Whitepaper · August 2026
The Revenue Intelligence Gap
Why disconnected reporting cannot answer the questions growth teams are paid to answer
A practical paper for founders, marketing leaders, RevOps teams, agencies, and revenue-accountable operators.
Executive summary
Most growth teams do not lack data. They lack a trustworthy way to put it together.
Campaign dashboards report clicks, leads, and platform ROAS. The CRM reports contacts, opportunities, and pipeline. Call tracking lives somewhere else. Billing or commerce systems hold the revenue that matters. Each view can be internally consistent while telling a different story about the same customer.
That creates a familiar meeting. Marketing can show demand. Sales can show pipeline. Finance can show revenue. Nobody can clearly explain how one became the next.
This is the revenue intelligence gap: the distance between the activity trapped in go-to-market systems and the revenue decisions a business still has to make. It shows up when teams cannot reconcile platform claims, when early anonymous research disappears from the customer record, when phone calls vanish from reporting, or when a channel looks efficient at the lead stage but produces low-quality opportunities downstream.
The usual response is to add another dashboard or choose a different attribution model. Both can help at the margins. Neither resolves the core problem if the underlying relationships among touchpoints, people, accounts, opportunities, orders, and revenue are broken.
A more useful approach starts with a connected revenue model. Convertmax calls this model a Revenue Graph: a first-party structure that preserves relationships across the customer journey so reporting can follow the path from interaction to business outcome4. It is not a promise that every influence can be measured perfectly. It is a practical way to make decisions from a fuller, more defensible record of what happened.
The goal is not a more flattering dashboard. The goal is a shared operating view of how revenue was created, where it is leaking, and what should change next.
This paper explains why the gap exists, what a revenue graph changes, and how leaders can build a reporting system that is useful under scrutiny.
1. The report is not the system
A growth team can have dozens of reports and still be flying half-blind. The issue is not effort. It is that the reports were designed for different jobs.
An advertising platform is built to report activity and optimization signals within its own environment. A web analytics tool is built to observe behavior on digital properties. A CRM is built to help manage relationships and sales work. A billing system is built to record commercial events. A call-tracking product is built to record conversations. Each system captures a genuine part of the story. Few are built to preserve the full story between them.
The systems fragment the story by design. Recent Salesforce research, based on a double-anonymous survey of 4,450 marketing decision makers, found that only 58% of marketers had complete access to service data, 56% to sales data, and 51% to commerce data. The same research identifies siloed systems and poor data quality as major barriers to relevant customer experiences3.
For a revenue leader, this is not merely a data-management concern. It changes the decision itself.
| When the data is disconnected | What the team risks doing |
|---|---|
| A platform reports a conversion that the CRM cannot connect to a qualified opportunity | Treating platform-reported efficiency as revenue efficiency |
| A call occurs outside the web analytics path | Underestimating channels and pages that create high-intent conversations |
| Anonymous sessions never connect to a later contact or customer | Crediting only the final interaction and ignoring demand creation |
| Lead volume is visible but customer value is not | Scaling channels that produce cheap, low-quality demand |
| Revenue arrives in a billing or commerce system after the marketing report has closed | Optimizing to early proxy metrics rather than commercial outcomes |
None of these systems is necessarily wrong. They answer different questions with different identifiers, time windows, definitions, and rules for credit. The error happens when a team treats the output of any one system as the whole truth.
The false comfort of a single number
A familiar request sounds simple: “Which channel drove the revenue?” It rarely is.
A customer may first discover a company through paid social, return through organic search, attend a webinar, call a salesperson, open several emails, and convert weeks later after a branded search. A last-click report can identify the final observed step. A platform may claim credit for a view or click in its own window. The CRM may recognize only the source captured on form submission. All of those statements can coexist, but they are not interchangeable.
The practical problem is not that teams need one universal attribution model. It is that they need a shared record of the journey and an explicit method for interpreting it. Without that foundation, model debates become a substitute for evidence.
2. The five breaks that create the revenue intelligence gap
2.1 Platform measurement is not a neutral revenue ledger
Advertising platforms have their own conversion definitions, identity rules, attribution windows, and optimization incentives. They are valuable systems of record for media activity. They should not be treated as a neutral ledger for total business revenue.
The same downstream outcome can be claimed by multiple platforms because each has visibility into a different interaction. That does not make the platforms dishonest. It means their reports were not designed to reconcile against one another by default.
A revenue view needs a separate point of reference: a first-party model that can hold campaign and channel activity alongside pipeline, orders, and revenue. Convertmax positions its platform as that neutral view, using first-party journey data to connect go-to-market activity with revenue outcomes4.
2.2 The customer journey begins before the lead record
A person does not become a customer at the moment a CRM record appears. Long before a form, trial, purchase, or call, they may have read pages, compared solutions, returned from email, and engaged with paid or organic content. If those early interactions remain anonymous and never join the known record, the analysis begins too late.
That is why first-party data matters. Google defines it as information a business directly collects and owns with customer consent, and describes privacy-preserving measurement as a key part of an advertising strategy2. The distinction is important. First-party collection is not permission to collect anything at any time. It is an approach that asks the business to capture data on its own properties, use it responsibly, and honor the rules that apply to its audience and jurisdiction.
2.3 Calls and offline events fall through the cracks
Many journeys do not end in an online checkout. They end in a conversation, a sales meeting, a contract, an invoice, or a renewal. If those events cannot be connected back to their source, an organization overvalues channels with easy-to-count digital conversions and undervalues the paths that create serious commercial intent.
This matters for B2B, high-consideration services, high-value lead generation, and many ecommerce categories. A channel can look weak when judged by form fills but strong when judged by opportunity quality or customer value. A useful revenue model has to retain both views.
2.4 Proxy metrics become the optimization target
Teams often optimize to whatever arrives first: click-through rate, cost per lead, demo booked, free trial, or cart creation. Those metrics can be useful. They are not revenue.
Proxy metrics become dangerous when the organization forgets the difference. A cheaper lead source may yield fewer qualified opportunities. A campaign that appears expensive at the acquisition stage may create high-value customers later. Without downstream feedback, teams are rewarded for improving the proxy while harming the business outcome.
2.5 Reports tell a story, but relationships explain one
A report is an output. A revenue graph is the map beneath it.
That map retains the connections among interactions, identities, accounts, opportunities, orders, and revenue events. Once the relationships are intact, the organization can ask different questions. It can compare models, investigate stalled stages, trace a call back to a campaign, or look at customer value by acquisition source. The point is not a prettier visualization. It is being able to follow the thread.
3. A Revenue Graph: the missing operating layer
Convertmax describes the Revenue Graph as a model that connects touchpoints, customers, and revenue events across the stack4. In plain language, it is a connected representation of the journey that allows the business to keep its existing systems while making the relationships between their records usable.
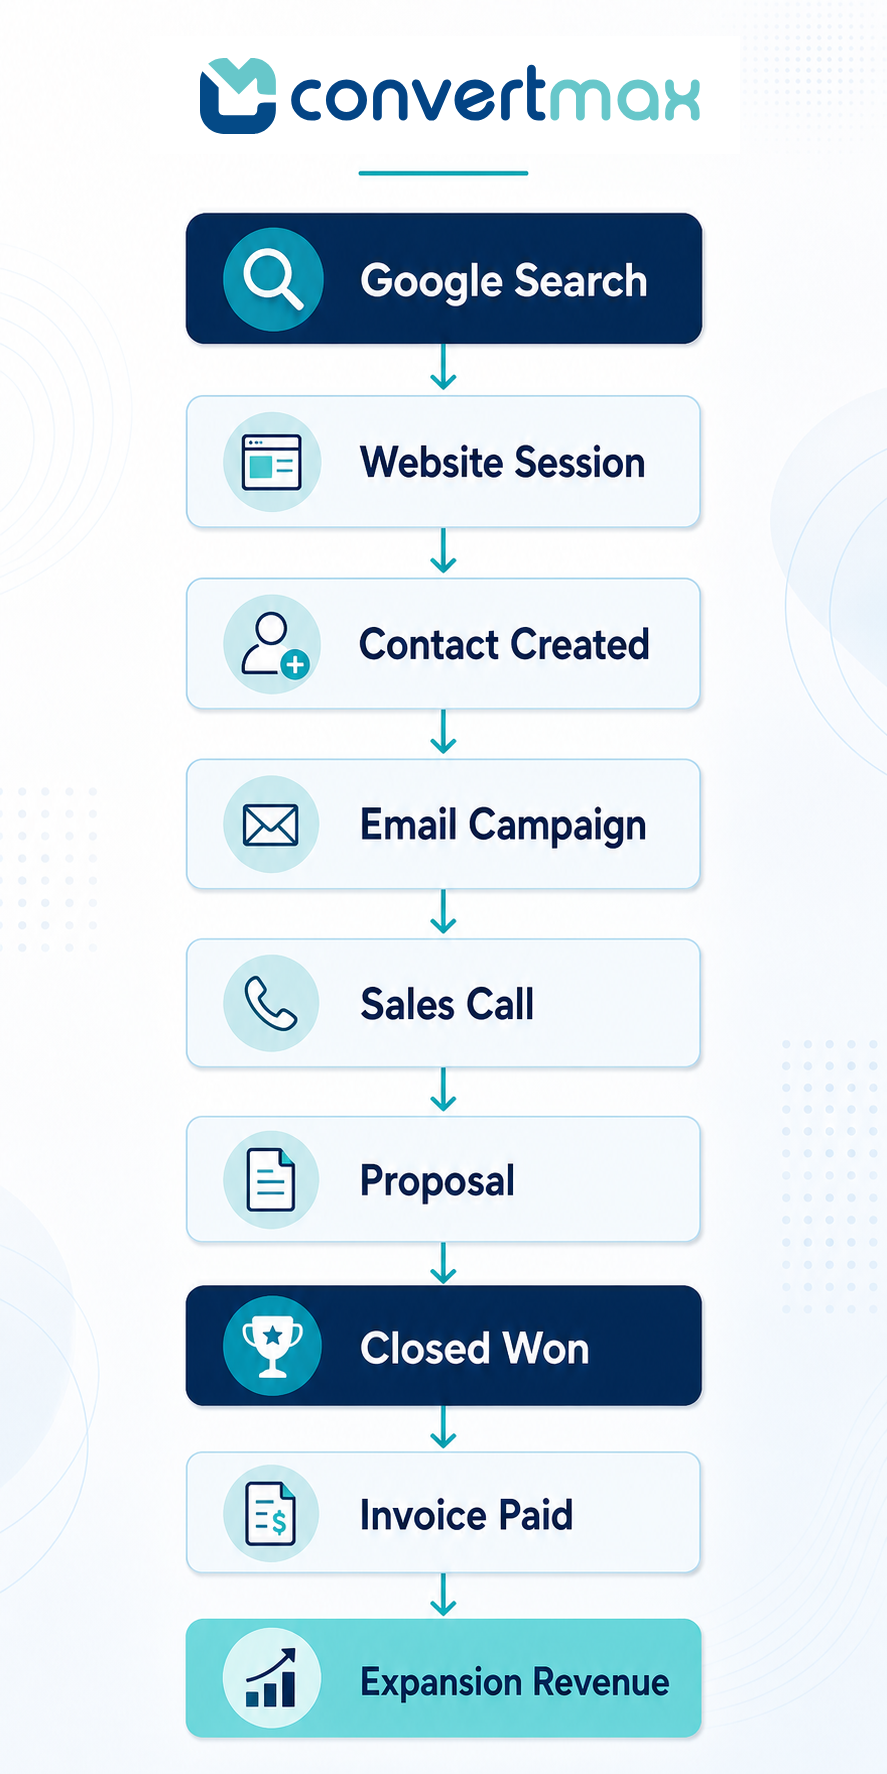
The graph does not try to replace a CRM, commerce platform, advertising account, or data warehouse. Those systems still perform their own jobs. The graph acts as a connective layer, preserving the relationships required for revenue analysis.
| Layer | What it contains | Why it matters |
|---|---|---|
| Journey capture | Anonymous site sessions, forms, calls, campaign parameters, product events, and commerce activity | It retains the signals that happen before a person becomes a known record. |
| Identity and relationship resolution | Links among sessions, contacts, accounts, opportunities, orders, and other first-party signals | It keeps the journey connected as a customer becomes known. |
| Commercial outcomes | Qualified pipeline, closed revenue, repeat purchases, and customer value | It shifts analysis from activity to the outcomes the business is trying to create. |
| Decision layer | Channel analysis, journey analysis, revenue-leak analysis, and budget decisions | It gives operators a shared basis for action rather than a collection of disconnected exports. |
This approach lines up with a broader industry direction. Google’s Ads Data Hub documentation says that joining advertising data with first-party data can create a more complete picture of engagement and contribute to better attribution. It also makes a useful caution: match rates vary by implementation and may be lower than users expect1.
That caveat should be welcomed, not hidden. Good measurement is not about claiming omniscience. It is about making the missing pieces visible, improving coverage where it is possible, and being clear about uncertainty where it remains.
4. What better revenue intelligence makes possible
When the relationships are connected, teams can move from generic questions to operational ones.
Reconcile performance before reallocating budget
Instead of asking which dashboard is “right,” a team can compare platform-reported performance with a first-party revenue view. The question becomes: Which channels, campaigns, and journeys are associated with qualified pipeline, closed revenue, and customer value under a clearly defined method?
That makes budget conversations calmer. The team can still use platform metrics for tactical management, but it no longer has to mistake each platform’s claim for a complete business outcome.
Diagnose revenue leaks, not just conversion rates
A funnel can show where conversion drops. A connected revenue model can help explain what happened around the drop.
Consider a paid campaign with strong lead volume and weak pipeline creation. The problem could be targeting, messaging, lead routing, qualification, sales follow-up, or a mismatch between the offer and the audience. The right next step is not always to turn spend off. It is to identify the stage and journey pattern where the relationship breaks.
Evaluate acquisition quality
Lead count is an incomplete scorecard. A channel that creates fewer leads may deliver more qualified opportunities, faster sales cycles, greater revenue, or stronger long-term value. Convertmax is built to connect channel activity to pipeline, purchases, and downstream customer outcomes, allowing teams to judge source quality beyond final-click or lead-volume metrics4.
Keep calls in the commercial record
Calls are often high-intent interactions, yet they are commonly managed in a separate tracking tool. When source, call, CRM progression, and revenue can be connected, the business can see whether those conversations actually create commercial value. This is especially valuable for agencies, lead-generation businesses, and teams selling through consultations or sales development.
Give AI systems useful context
The promise of AI does not remove the need for connected data. It raises the cost of not having it. Salesforce reports that marketers cite siloed systems and poor data quality as the top barriers to AI-driven personalization, and that high performers are more likely to have unified data sources3.
The same logic applies to revenue operations. An AI assistant can summarize a report. It cannot reliably explain a customer journey that the underlying data failed to connect. A revenue graph provides context for analysis, not just rows for a model to summarize.
5. Attribution needs intellectual honesty
Attribution is a decision framework. It is not a time machine.
It can help a team see how touchpoints relate to pipeline and revenue. It cannot, on its own, prove that a particular touchpoint caused a purchase to happen. Customer decisions are shaped by product, price, sales execution, brand, market conditions, competition, and many interactions that may never appear in a system.
That is why a mature measurement practice uses multiple methods for different decisions.
| Question | Useful evidence | What to avoid |
|---|---|---|
| Which journeys are associated with qualified pipeline? | First-party journey records, CRM stages, and a declared attribution model | Treating a single platform export as the full answer |
| Which media investment appears to be working? | Reconciled revenue reporting, controlled tests where practical, and cohort trends | Reallocating budget on last-click data alone |
| Why do two platforms report different ROAS? | Comparison of definitions, attribution windows, identity coverage, and conversion rules | Assuming one total can be added to the other |
| Which sources create the best customers? | Closed revenue, repeat behavior, margin or value metrics where available | Ranking channels only by lead count |
A decision-ready system should show the model, the definitions, and the data coverage. It should permit disagreement without permitting confusion.
There are also practical boundaries. First-party data strategy should reflect consent, privacy requirements, data-retention practices, and the needs of the business. Google’s guidance emphasizes consent and privacy-preserving measurement; organizations should seek appropriate legal and privacy advice for their own implementation2. Data integration has limits too. Identifier coverage can be incomplete. Records can arrive late. Different teams can use different definitions of a qualified lead or closed revenue. Those are governance issues, not reasons to give up on measurement.
6. Building a decision-ready revenue model
The best implementations do not start by buying more dashboards. They start by agreeing on what the business needs to know.
Start with decisions, not fields
List the decisions that recur: where to invest the next dollar, which campaigns to scale, what source quality looks like, which funnel stage leaks revenue, and how to explain marketing’s contribution to the board. Those decisions define the required relationships.
Establish commercial definitions early
A lead, qualified opportunity, influenced pipeline, closed revenue, customer value, and return on ad spend should mean one thing across the reporting environment. Teams can debate the definitions, but they cannot operate effectively without choosing them.
Connect the relevant events
Most businesses do not need every data point connected on day one. They need the critical spine of the journey: campaign and channel context, first-party sessions, identity signals, CRM stages, calls where relevant, orders or billing events, and revenue outcomes. Convertmax states that its platform connects these categories across marketing, sales, CRM, call, and commerce activity4.
Choose a method and retain the evidence
Attribution should be explicit. Whether the team uses position-based, linear, time-decay, model comparison, or another method, stakeholders should know how credit is assigned. The output should be inspectable at the journey level when someone asks a reasonable question about the total.
Run a recurring reconciliation
A revenue model is an operating discipline. It needs regular checks against the systems that supply it. Reconcile counts, examine late-arriving revenue, review unlinked records, and surface changes in tracking or CRM process before they become reporting surprises.
7. The questions every growth leader should be able to answer
A healthy revenue reporting system should make the following questions answerable without assembling a custom spreadsheet every time.
| Strategic question | A decision-ready answer connects |
|---|---|
| Which channels create the most closed revenue? | Campaign and channel activity to CRM, billing, or commerce outcomes |
| Which campaigns create quality, not simply volume? | Acquisition source to opportunity progression, close rate, and customer value |
| Where is revenue leaking? | Journey stages, conversion points, qualification, and downstream outcomes |
| Which calls became customers? | Call source, conversation event, CRM record, and revenue result |
| Why do reporting systems disagree? | Their identities, definitions, windows, and crediting rules |
| What should receive more budget next month? | A reconciled evidence set, stated method, and the commercial objective being optimized |
If those questions require a different export from each system, the organization does not have revenue intelligence. It has reporting fragments.
Closing perspective
Growth does not become easier when a team collects more activity data. It becomes easier when the business can follow the connections that matter.
That is the work of revenue intelligence: not to manufacture certainty, but to replace avoidable guesswork with a shared record of journeys, commercial outcomes, and decisions. The Revenue Graph is a practical way to build that record. It keeps early signals, known customer records, pipeline, calls, purchases, and revenue in the same analytical story.
The question is not whether every touchpoint can be measured perfectly. It cannot. The question is whether your current reporting can show a defensible path from go-to-market activity to revenue, and whether your teams can act on it together.
Convertmax helps revenue-accountable teams connect first-party customer journeys with multi-touch attribution, pipeline, and closed revenue. Explore Convertmax or request a free Revenue Audit.
References
- Google Ads Data Hub: Join first-party data
- Google Ads: Use first-party data to power your ad strategy
- Salesforce: 75% of Marketers Have Adopted AI, Yet Still Use It To Send One-Way, Generic Campaigns
- Convertmax | Revenue Intelligence Platform
For the quantitative companion to this paper, read The 2026 Revenue Attribution Gap Report.
This paper is intended as general business and measurement information. It is not legal, privacy, financial, or tax advice. Attribution is a decision-support method and should be interpreted alongside sound commercial judgment and, where appropriate, testing.