By Elena Marsh
The Revenue Graph connects the journey. Apache Ossie gives it shared meaning.
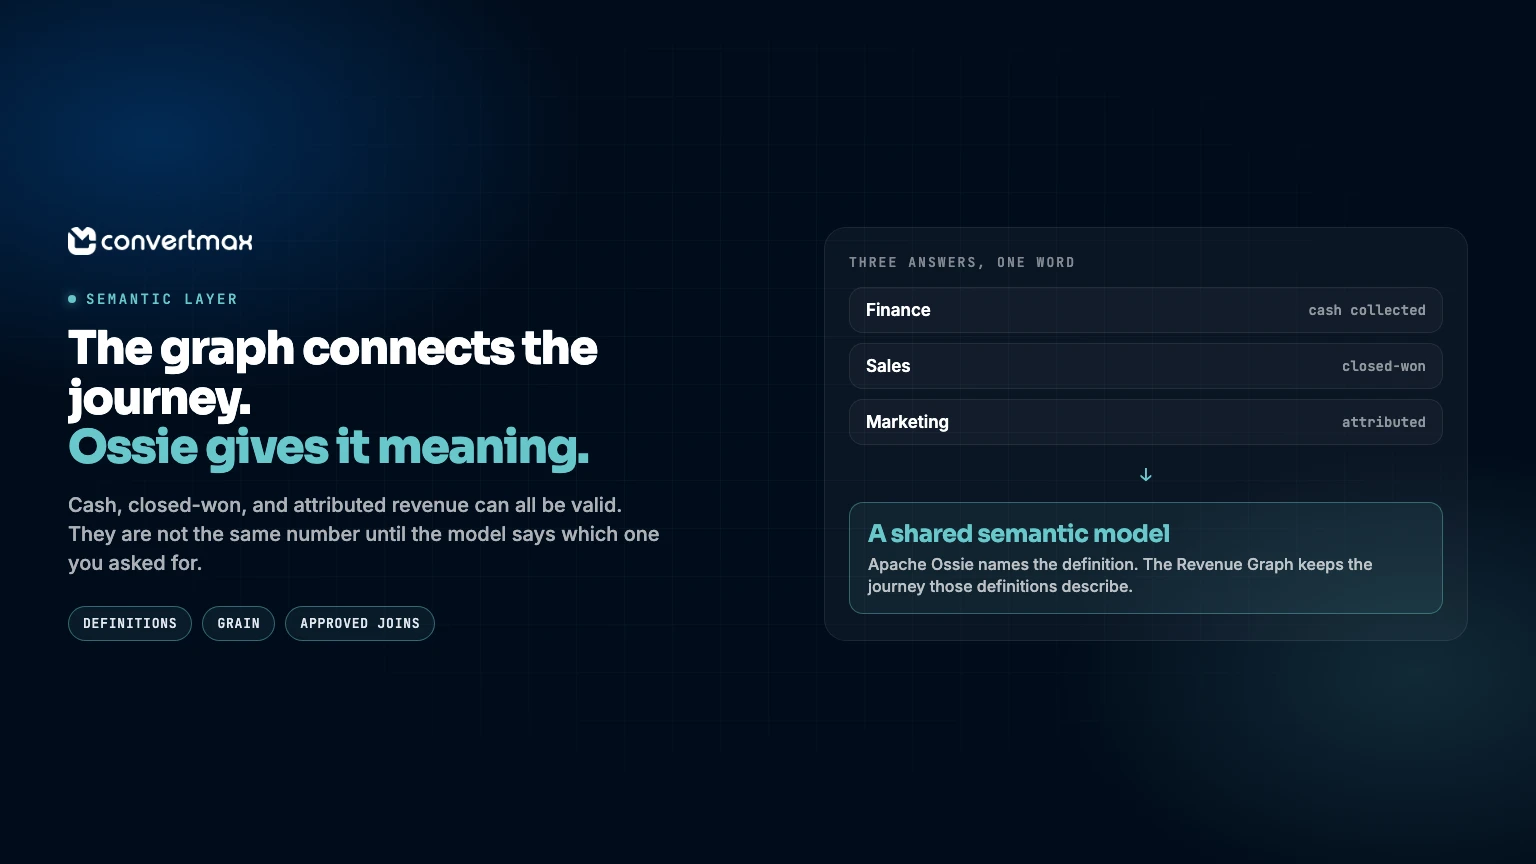
Ask three people how much revenue the company made last quarter and you may get three answers.
Finance might mean cash collected, after refunds. Sales might mean the value of deals marked closed-won. Marketing might mean revenue attributed to campaigns. Each number can be valid for its purpose. The problem starts when everyone calls them “revenue” and assumes they are looking at the same thing.
Connecting data from different systems helps, but it doesn’t settle what the numbers mean. For that, teams need a shared semantic model: agreed definitions, clear relationships, and rules for how those relationships can be queried.
At Convertmax, that model sits on top of the Revenue Graph. We use Apache Ossie—the open, industry-wide specification for semantic models—to give the model a common structure. The graph connects the journey. The semantic layer explains how to read it.
A connected journey is a starting point
A revenue journey rarely lives in one system. A person might first arrive through a campaign, browse a website, submit a form, speak with Sales, become part of an account, and eventually generate an order or a paid invoice. Each system captures one part of that story.
The Revenue Graph methodology describes how those records can be connected: sessions to people, people to accounts, people to calls and opportunities, and orders or opportunities to revenue events. The graph keeps those relationships available as the journey moves across tools.
That connection matters. Without it, a report may show campaign clicks beside closed deals without a reliable way to tell whether they belong to the same journey. But a connected graph still leaves important questions open. What counts as revenue? Which campaign-to-person path is valid? Can session-level facts be added to event-level revenue without counting the same outcome twice?
Those are questions of meaning and rules, not just data collection.
What the semantic layer does
A semantic layer gives people and software a consistent way to interpret the data. It describes the business concepts in the model and the rules for using them.
For revenue analysis, that can include:
- Definitions: Does “revenue” mean pipeline, booked sales, collected cash, or net revenue after refunds?
- Entities and dimensions: What do “person,” “account,” “campaign,” and “channel” refer to?
- Grain: Is a fact true for each session, order, invoice, or revenue event—and which rollups make sense?
- Relationships: Which records can be joined, in what direction, and with what cardinality?
- Ownership and status: Who maintains a definition, and is it certified, experimental, or retired?
These details can sound like data-team housekeeping. They’re not. They determine whether a reported number answers the question people think they asked.
Why Apache Ossie matters
Semantic definitions are most useful when they don’t have to be reinvented for every tool. Apache Ossie, formerly known as Open Semantic Interchange, is an open specification for exchanging semantic models across analytics, business intelligence, and AI platforms. It describes common building blocks such as datasets, fields, metrics, dimensions, and relationships in a shared model. You can learn more from the Apache Ossie project.
Convertmax uses Apache Ossie as the standard for its semantic model. That gives the layer a common structure rather than tying its definitions to a one-off, Convertmax-only format. The semantic model describes the business meaning; the Revenue Graph supplies the connected journey those definitions apply to.
Ossie doesn’t create missing data or decide whether a business definition is right. And a shared format on its own doesn’t make every tool automatically compatible. The value is a common, open way to represent meaning, which makes it easier to keep definitions clear and to move them between supported parts of the data ecosystem.
A field called `amount` is not a revenue definition
Imagine a source table with a column called amount. It may contain a number, but it doesn’t tell you what the business should count.
Should revenue include an order as soon as it is placed, or only after payment? Should refunds reduce the total? Which exchange rate should apply when the customer pays in another currency? Should internal test accounts be excluded?
A team might define a particular metric as collected cash, net of refunds, excluding test accounts, and converted to USD using the rate on the booking date. Another business might need a different definition. The point is not that there is one correct answer for every company. The point is to make the chosen definition explicit and use it consistently.
The same goes for attribution. If someone asks which campaigns influenced that revenue, a metric definition is only part of the answer. The model also needs to describe how sessions connect to people, and how those people connect to the relevant orders or opportunities. Otherwise, a precise calculation can still be based on the wrong records.
The quiet ways a number goes wrong
Some data problems are obvious. Others produce tidy dashboards and confident answers.
One common issue is fanout. If several contacts from one account connect to the same opportunity, a careless join can multiply the opportunity value. A campaign may then appear to have influenced far more pipeline than it did.
Another is double counting. Session-level revenue and revenue-event-level facts describe different grains. Add them together without a valid aggregation rule and the total can be inflated.
There’s also metric drift: Marketing, Sales, and Finance gradually adopt different definitions of “revenue.” Each report may look internally consistent, but the numbers won’t line up when the team tries to make a shared decision.
A semantic model makes the assumptions visible. It can state which definition applies, what level a fact belongs to, and which relationships are approved. The data and the model still need to be right, but disagreements become easier to trace to a specific rule instead of being buried in a spreadsheet or a dashboard calculation.
Follow one question through the model
Consider this question: Which campaigns influenced the deals that closed, including calls, over a 180-day cycle?
To answer it responsibly, the system first needs to identify the relevant closed-won revenue events. It then follows the approved identity and relationship paths to find the people, sessions, campaigns, calls, and opportunities connected to those outcomes. The agreed 180-day window and attribution model are applied, and the results are aggregated at a level that doesn’t count the same revenue twice.
That process depends on both parts of the model. The Revenue Graph preserves the relationships across the journey. The semantic layer supplies the definitions, grain, and approved paths used to interpret them. Apache Ossie provides the open structure for representing the semantic model; Convertmax applies that model to the revenue context in the graph.
The answer should also be explainable. If two reports disagree, a person should be able to see which definition, time window, and join path produced each result. That turns “the dashboards don’t match” into a question the team can actually investigate.
A complement to warehouse semantic models
Many data teams already use tools such as dbt Semantic Layer or LookML to define metrics over warehouse data. Those models are valuable and can remain authoritative for the tables the data team owns.
Convertmax focuses on another part of the picture: the customer journey and the relationships between marketing activity, people, calls, opportunities, orders, and revenue outcomes. Apache Ossie gives semantic definitions a common format; the Revenue Graph connects the journey those definitions describe. The aim is to complement the warehouse model, not replace it.
Where supported, the connected model can be used alongside the rest of a company’s data estate through the product’s available interfaces and exports. Teams should still check which definitions and relationships are supported in each destination; an open standard is a foundation for interoperability, not a guarantee that every integration is automatic.
Start with one path you can trust
A useful semantic layer doesn’t have to begin with every metric in the company. Start with one revenue definition people agree on, a small set of entities, and one connected path from a first-party journey to a revenue outcome.
Give the definitions owners. Finance may own revenue semantics. Marketing may own campaign and channel taxonomy. RevOps may own identity keys and the rules for deciding when records match. When a definition changes, the team should know who can update it and how that change reaches everyone using it.
Once the first path is reliable, expand it. Add calls if they’re an important part of the buying journey. Add subscription or refund detail when those facts change the decisions people need to make. Build out the model in response to real questions, not just because more fields are available.
One question, shared rules
A Revenue Graph keeps the journey connected. A semantic layer makes the meaning and rules behind that journey explicit. Apache Ossie gives Convertmax an open standard for representing the semantic model.
Together, those pieces help teams ask the same revenue question across people, dashboards, exports, and AI without silently changing what the words mean or how the records connect. They don’t make every answer automatically correct. They make it easier to see how an answer was built—and easier to fix the model when it isn’t right.
Learn more about the Convertmax semantic layer and the Revenue Graph data-model methodology.