By Elena Marsh
The Revenue Graph Data Model: Connecting Journeys, Systems, and Closed Revenue
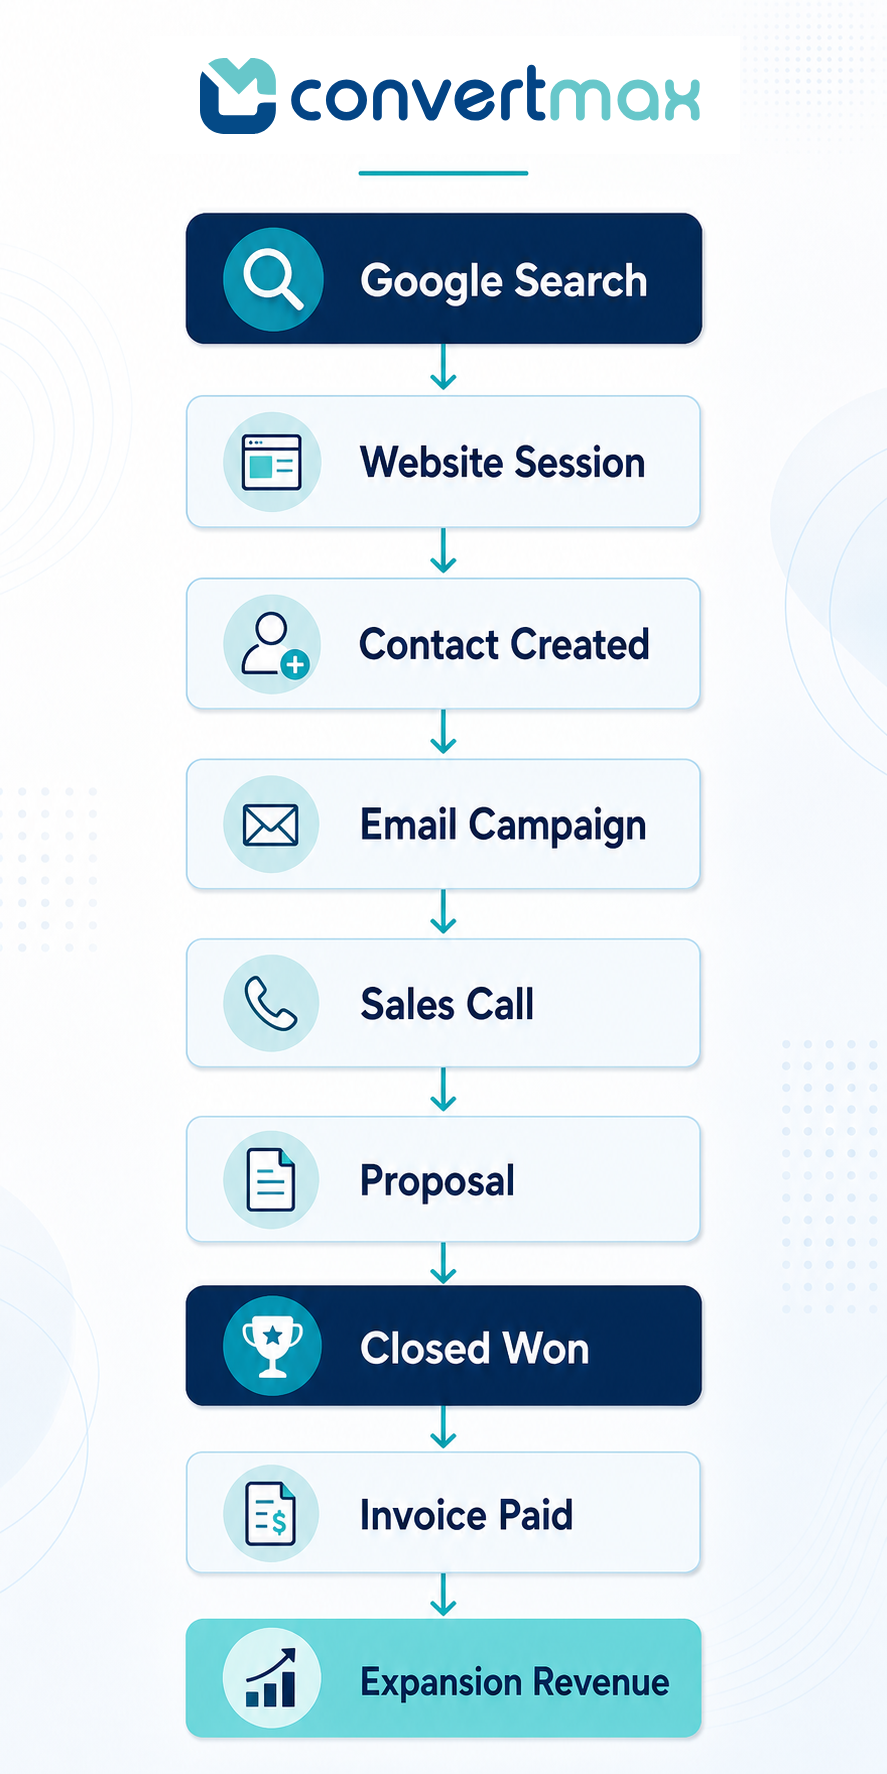
Most companies do not lack data. They lack relationships. CRM tables, ad exports, call logs, ecommerce orders, and product events each tell a partial story. When those records are not connected, reporting becomes reconciliation theater—and AI assistants get isolated facts instead of a revenue engine they can reason over.
A Revenue Graph is Convertmax’s model for keeping people, touchpoints, business systems, and revenue events connected. It underpins revenue intelligence on the platform. For the product thesis, see The Revenue Graph article. This methodology focuses on the data model: entities, edges, how attribution queries the graph, and how to build connected measurement without boiling the ocean.
Why siloed tables lose the plot
| Siloed approach | What you see | What you lose |
|---|---|---|
| Ad platform export | Clicks, platform conversions | Closed revenue, assists, CRM quality |
| CRM-only reporting | Pipeline and won deals | Pre-CRM journey and campaign truth |
| GA4 / web analytics | Sessions and goals | Calls, invoices, multi-system identity |
| Commerce admin | Orders and SKUs | Acquisition path and LTV by channel |
| Warehouse star schemas without graph intent | Joins you must re-invent | Stable relationship semantics for product + AI |
A graph does not magically create missing events. It preserves edges so a closed-won deal remains tied to the sessions, campaigns, and calls that preceded it.
Core entities
| Entity | Meaning | Typical sources |
|---|---|---|
| Person | Individual buyer / user | Forms, CRM contacts, commerce customers |
| Account | Company / household / org | CRM accounts, B2B enrichment |
| Session | Visit on owned properties | First-party analytics |
| Campaign / Channel | Marketing investment unit | UTMs, ad platforms, email |
| Touchpoint | Interaction node (page, content, ad click) | Web, email, ads |
| Call | Phone conversation | CallRail, CTM, etc. |
| Opportunity | Sales pipeline object | CRM |
| Order / Invoice | Commerce or billing outcome | Shopify, Magento, Vendure, Stripe |
| Revenue event | Normalized money outcome | Closed-won, paid invoice, refund |
| Convert | UCP-normalized outcome event | Web, CRM, calls, commerce |
Edge types (relationships that matter)
- Campaign influenced Session; Session belonged to Person
- Person is member of Account
- Person placed Call
- Person owns Opportunity; Opportunity produced Revenue event
- Person placed Order; Order produced Revenue event
- Session or Campaign assisted Convert (UCP)
- Agentic context labeled on Session or Convert
Edges are the difference between “we have a Google Ads row” and “this $48k deal was assisted by three campaigns and two calls.”
CRM-alone vs Revenue Graph
| Question | CRM alone | Revenue Graph |
|---|---|---|
| When did the journey start? | Often at lead create | At first first-party session |
| Which campaigns influenced the deal? | UTM fields if lucky | Connected touchpoints + converts |
| Did calls matter? | Notes / activities if logged | First-class call nodes with source |
| What is LTV by channel? | Hard / incomplete | Traversable person → orders → revenue |
| Can AI explain a revenue dip? | Partial CRM context | Cross-system neighborhood of the graph |
| Vendor lock-in | High if CRM is center of universe | CRM is one source among many |
Convertmax is CRM agnostic by design: the graph is the intelligence layer; the CRM is a critical operational system, not the only truth.
How attribution queries the graph
Attribution is a walk over time-ordered touchpoints and converts for a person (or account), ending at a revenue event:
- Select revenue events in a period (closed-won, paid orders).
- Resolve the person/account neighborhood.
- Collect ordered touchpoints and UCP converts before the outcome (and within your lookback policy).
- Apply a model (first, last, linear, U-shaped, time-decay, data-driven).
- Aggregate credit to campaigns/channels for budget decisions.
Without edges, step 3 collapses into last-click folklore. With edges, models become comparable experiments on the same facts.
Data flow architecture
- First-party web/app, call tracking, CRM, commerce/billing, and product events feed identity resolution.
- Identity resolution writes into the Revenue Graph.
- UCP converts attach to the same people and accounts.
- Attribution, journey, and LTV views read from that connected model.
First-party analytics feed sessions under ITP constraints. UCP normalizes converts. The graph stores both as connected structure for revenue intelligence.
Methodology: build connected measurement in sequence
- Pick the revenue definition — pipeline, booked, collected, or net. Write it down.
- Instrument first-party journeys — owned-domain collection before pixel archaeology.
- Choose identity keys — email, CRM ID, commerce ID; enforce on known converts.
- Connect one CRM or commerce source end-to-end — prove one closed path before adding five integrations.
- Add calls if phone is a conversion path — otherwise high-intent demand stays invisible.
- Normalize converts with UCP semantics — same language across emitters.
- Label agentic traffic — protect human revenue metrics (Agentic Commerce).
- Compare attribution models on the graph — do not swap tools to change the story; change weights on shared facts.
- Operationalize decisions — budget, creative, sales routing—from graph-backed reports, not platform screenshots.
Example questions the graph should answer
- Which campaigns assisted deals that closed above a revenue threshold after including calls?
- Which channels create customers with higher repeat order rate—not just first purchase?
- Where do journeys drop between first session and opportunity create?
- Which AI referrals correlate with qualified pipeline without counting agent crawlers as buyers?
- Why did revenue in a region decline—campaign mix, sales velocity, or acquisition quality?
These are relationship questions. Flat exports struggle; a Revenue Graph is built for them—and for AI systems that need coherent context rather than disconnected rows.
Minimal viable graph vs mature graph
You do not need every entity on day one.
| Stage | Entities in scope | Decision unlocked |
|---|---|---|
| MVP | Session, Person, Campaign, one Revenue event (CRM or commerce) | Channel contribution to closed revenue |
| Growth | + Call, Opportunity stages, Order line items | Sales-assist and product mix quality |
| Mature | + Account buying committees, product usage, agentic labels, refunds | LTV, expansion, AI-era demand quality |
Expand breadth only after one vertical path is trustworthy. A shallow graph with clean identity beats a wide graph of contradictory joins.
Anti-patterns
| Anti-pattern | Why it hurts |
|---|---|
| Making the CRM the only node that “counts” | Erases pre-CRM demand creation |
| Storing campaigns only inside ad platforms | Breaks historical joins when accounts change |
| Deduplicating people aggressively without keys | Merges strangers; corrupts attribution |
| Ignoring refunds/churn edges | Overstates channel LTV |
| Feeding AI raw unrelated CSVs | Models guess relationships the graph should declare |
Quality checks before you trust a report
- Coverage — What share of closed revenue events have at least one pre-CRM marketing touchpoint?
- Identity — What share of revenue events resolve to a person with a durable key?
- Ambiguity — How often is channel still Direct/none after enrichment?
- Conflict — How far do ad-platform claimed conversions diverge from graph-attributed revenue?
- Stability — Do model comparisons move budgets the same direction week over week, or is the graph still shifting under you?
If coverage and identity are weak, fix collection before debating U-shaped vs data-driven weights. Models cannot repair missing edges.
From graph to operating rhythm
- Weekly — channel contribution vs spend on shared revenue definition.
- Monthly — journey quality (LTV, win rate, sales cycle) by source.
- Quarterly — model policy review with marketing, sales, and finance.
- Continuously — exception queues for high-revenue deals with broken identity or missing campaign context.
That rhythm turns the Revenue Graph from architecture into a management system.
What “good enough” looks like after 90 days
You do not need a perfect historical backfill to start. After roughly a quarter of clean first-party collection and connected converts, most teams can answer:
- Which two or three channels deserve more budget under a shared revenue definition?
- Which sources create meetings or orders that sales actually wants?
- Where Direct/none still dominates—and whether that is an identity gap or a true brand effect?
- Whether call paths are load-bearing for revenue or noise?
If those answers remain murky, the issue is usually missing edges or inconsistent convert types—not a shortage of dashboards. Fix the graph; then the reports get interesting.
Connected measurement is a product of discipline: shared revenue definitions, first-party capture, identity keys, and converts that mean the same thing in every system. The Revenue Graph is how that discipline stays durable as tools change. When relationships are explicit, budget debates get shorter—and AI answers stop hallucinating joins that were never in the data.