The Revenue Graph: Why We're Building the Next Generation of Revenue Intelligence
For years, companies have kept adding tools and hoping the reporting layer would eventually sort itself out. CRM, marketing automation, analytics, call tracking, ecommerce, support, warehousing. Every new system adds more data, but it usually adds more fragmentation too.
At Convertmax, we believe the next generation of revenue intelligence is not just another dashboard. It is a Revenue Graph: a model that keeps customers, touchpoints, and revenue events connected across your business.
Data Isn't the Problem. Relationships Are.
Most companies already have more data than they can use well. CRM records, campaign data, website sessions, calls, forms, emails, orders, quotes, invoices, support history, product usage, ad spend. The issue is not the lack of inputs.
The challenge is not collecting more information. The real challenge is understanding how everything connects.
Traditional reporting stores events in separate tables and separate tools. A Revenue Graph stores the relationships between them.
Instead of asking basic questions like "How many leads came from Google Ads?" you can ask something much more powerful: "Which Google Ads keyword generated the customer who eventually signed a $250,000 deal after three sales calls, two webinars, and six months of nurturing?"
Those are fundamentally different questions, and they require a fundamentally different approach to data.
What Is a Revenue Graph?
A Revenue Graph is a connected model of your revenue engine. Every person, company, session, opportunity, campaign, order, invoice, phone call, AI conversation, and sales activity becomes part of the same system.
Instead of looking at a pile of disconnected records, you have a structure that shows how events, people, accounts, and revenue outcomes relate to each other.
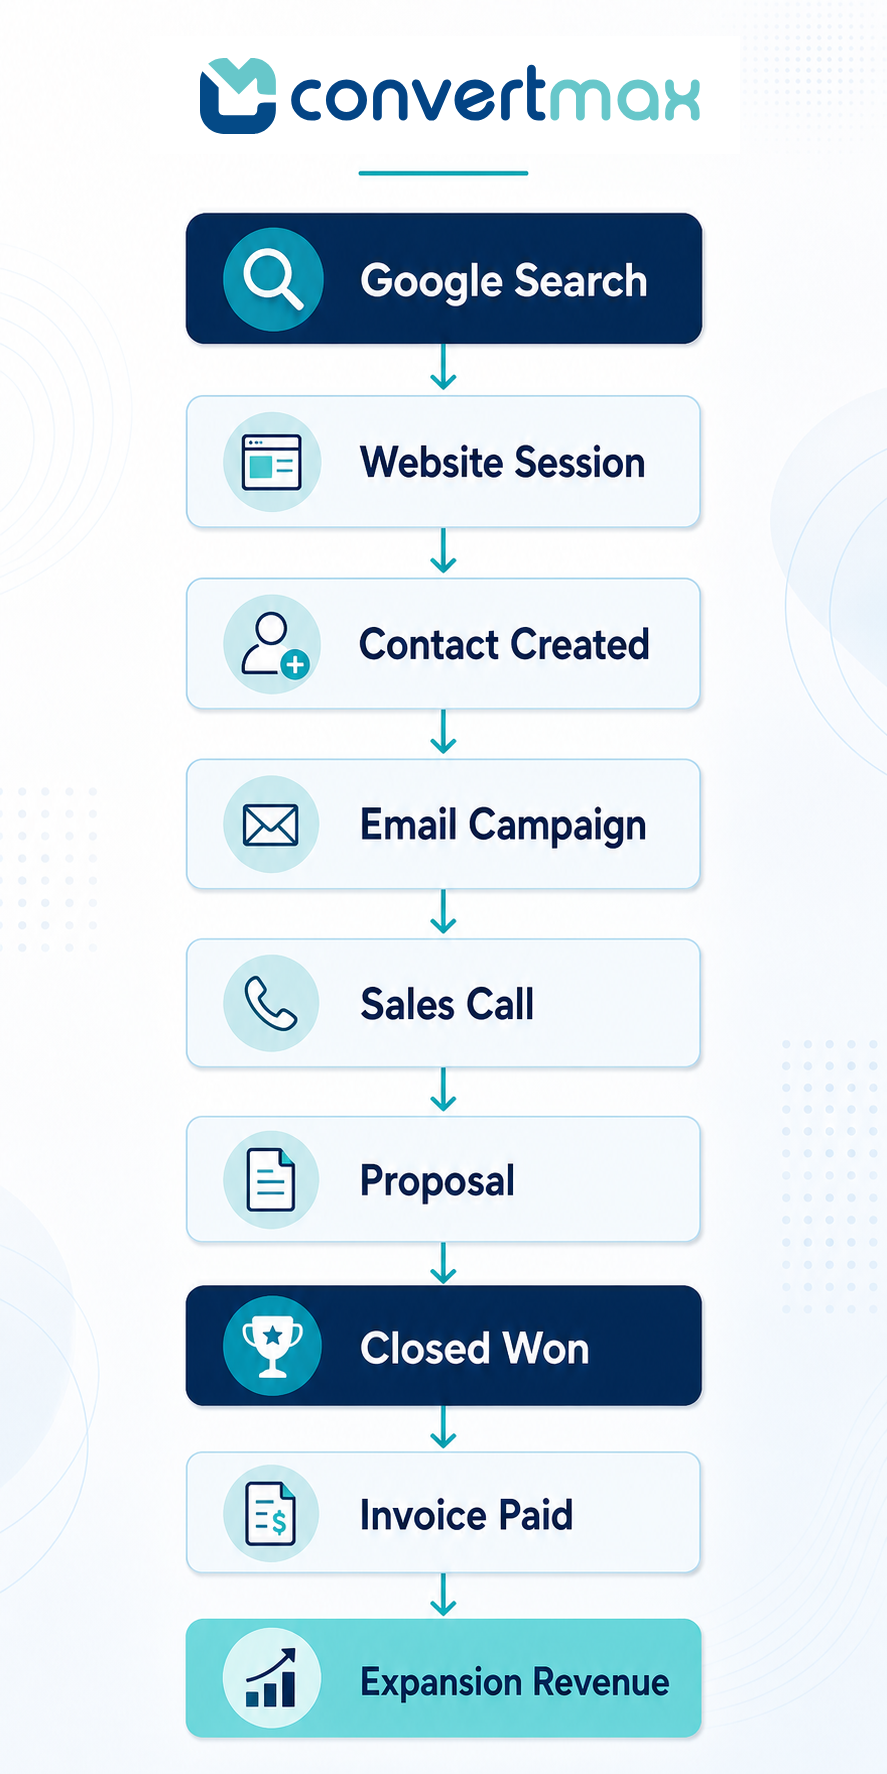
Consider a normal journey. A prospect starts with a Google search, lands on the site, becomes a contact, gets nurtured by email, books a sales call, receives a proposal, turns into a closed-won deal, pays an invoice, and later expands.
In a Revenue Graph, every single one of those steps remains connected. Nothing gets lost in the handoff between systems.
Revenue Is a Journey, Not a Transaction
Most attribution systems stop at the conversion. We do not think that is good enough.
Revenue continues long after someone fills out a form. Customers upgrade, renew, and refer others. They buy additional products, call support, leave reviews, and interact with AI agents. Every single one of these interactions changes the value of the customer relationship.
That is why we care more about the continuity of the relationship than the isolated conversion event.
CRM Agnostic by Design
Most software assumes your CRM is the center of the universe. We do not.
Companies change CRMs all the time. They use multiple CRMs across different departments, or they acquire businesses running entirely different systems. That is exactly why Convertmax is CRM agnostic.
Whether you are using HubSpot, Salesforce, Pipedrive, Close, GoHighLevel, Zoho, Dynamics, or a combination of several systems at once, the Revenue Graph becomes the consistent layer above them all. Your CRM becomes just one data source, rather than the ultimate source of truth. The Revenue Graph becomes the true intelligence layer.
Beyond Attribution
Attribution typically answers one simple question: "Where did this customer come from?"
The Revenue Graph answers harder questions. Which campaigns produce the best lifetime value? Which reps close certain channel-sourced leads better than others? Which phone conversations correlate with larger deals? Which AI conversations shorten the sales cycle? Which product behaviors show up before renewal or expansion?
These are business questions, not just marketing questions.
Built for AI
Large language models are much more useful when the underlying data is connected.
Instead of asking AI to search through disconnected systems, you can ask better questions: "Why did revenue decline in Ontario last month?" "Which customers are most likely to expand next quarter?" "Show me every opportunity influenced by webinars, phone calls, and LinkedIn."
Getting those answers requires understanding relationships, not just reading isolated records. That is why we think a graph structure is a stronger foundation for AI systems that need to reason across the full revenue journey.
The Revenue Operating System
We are not trying to build one more reporting layer.
We are building toward a platform where marketing, sales, customer success, support, ecommerce, and finance can work from the same connected model instead of stitching together partial views from separate systems.
Why This Matters
The Revenue Graph changes the underlying data model. Instead of treating each system as its own version of the truth, it gives teams one connected way to see how revenue is actually created.
That is what we are building at Convertmax. Not another dashboard. Not another CRM. A better underlying model for the systems that already influence revenue.
Because when every relationship is visible, every decision gets better.