By Elena Marsh
How to Measure Marketing Attribution: A B2B SaaS Guide
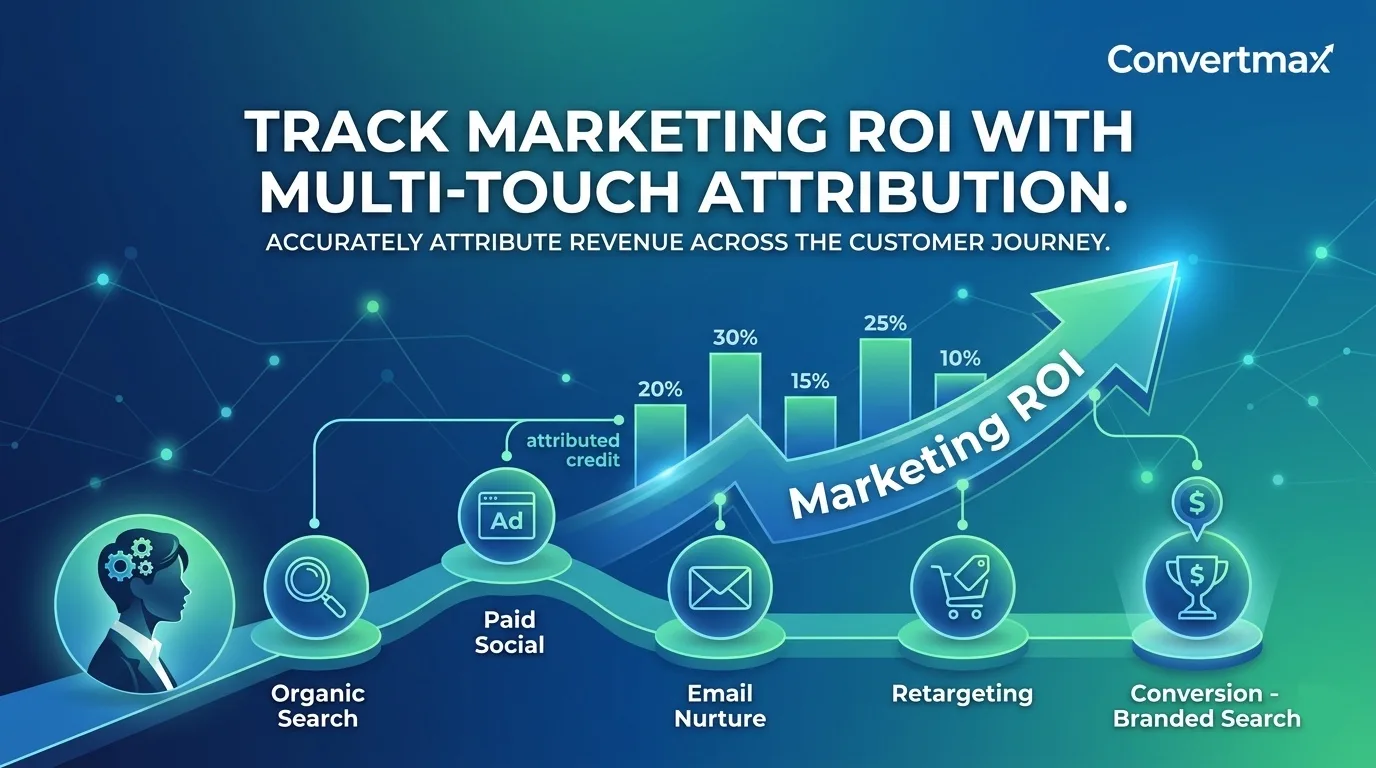
In B2B SaaS, understanding which marketing efforts actually drive revenue is a strategic imperative, not just an analytics exercise. Marketing attribution is the process of identifying and assigning credit to the marketing touchpoints that influence a customer's conversion journey. For B2B companies, that usually means attributing revenue to the campaigns, channels, and interactions that lead to a closed-won deal. The goal is to move beyond lead counts and see the full path from awareness to purchase, so growth teams can invest with confidence.
Why Accurate Marketing Attribution Matters for B2B SaaS Leaders
For founders, marketing leaders, and RevOps/GTM teams, accurate attribution is foundational to sustainable growth. Customer acquisition costs are high, sales cycles are long, and every marketing dollar needs to justify its contribution to the bottom line. Without clear attribution, investment decisions default to intuition or incomplete data, which leads to wasted spend and missed opportunities.
Accurate attribution provides the evidence layer that helps teams:
- Identify revenue-driving channels: See which channels (content, paid search, social, events, and more) generate qualified pipeline and closed revenue.
- Optimize budget allocation: Shift spend toward high-performing campaigns and maximize return on marketing investment.
- Improve lead quality: Spot the touchpoints that show up in high-value customer journeys and attract better-fit prospects.
- Shorten sales cycles: Find patterns in successful journeys that sales can replicate.
- Understand the full customer journey: See how prospects interact across touchpoints so engagement can be more relevant.
- Build credible reporting: Give stakeholders transparent, data-backed views of marketing's impact on revenue.
In short, attribution turns marketing from a cost center into a measurable revenue engine.
The Marketing Attribution Measurement Framework
Measuring attribution well in B2B SaaS takes a structured approach: clear definitions, solid data collection, precise calculation, and thoughtful segmentation. The goal is to move beyond last-touch defaults toward multi-touch models that reflect how B2B buyers actually buy.
Definition and Core Principles
Marketing attribution is the practice of determining which marketing efforts contributed to sales or conversions. In B2B, that often means assigning credit across multiple touchpoints over weeks or months, and across several people in a buying committee. The core principle is influence across the journey, not credit for a single event.
Data Requirements
Accurate attribution depends on complete, clean data:
- Customer journey data: Timestamps and details for every interaction (website visits, content downloads, email opens, ad clicks, demo requests, sales calls, and more).
- CRM data: Leads, opportunities, accounts, closed-won deals, deal value, and close dates.
- Marketing campaign data: Campaigns, channels, and associated costs.
- Identity resolution data: Ways to connect anonymous website visits to known contacts and accounts.
- First-party data: Data collected on your own properties, which is essential for reliable, privacy-compliant measurement.
Attribution Models: Distributing Credit Across the Journey
Different models distribute credit differently. The model you choose shapes what you conclude and what you fund next.
- First-touch attribution: Gives 100% credit to the first interaction. Useful for finding awareness channels; ignores nurture and conversion work that follows.
- Last-touch attribution: Gives 100% credit to the final interaction before conversion (often the analytics default). Useful for bottom-of-funnel optimization; undervalues earlier touches.
- Linear attribution: Splits credit equally across all touchpoints (five touches means 20% each). A balanced baseline; treats all touches as equally important, which is rarely true.
- U-shaped (position-based) attribution: Gives 40% to first touch, 40% to the lead-conversion touch (for example, a demo request), and splits the remaining 20% across middle touches. Values awareness and conversion milestones; fixed weights may not match your journey.
- Time-decay attribution: Gives more credit to touches closer to conversion. Fits shorter cycles; can undervalue early awareness work in long B2B cycles.
- W-shaped attribution: Similar to U-shaped, but also weights opportunity creation (typical split: 30% / 30% / 30% / 10%). Strong fit for B2B milestone funnels; still relies on predefined weights.
- Data-driven attribution (DDA): Uses machine learning to assign credit based on measured impact across paths. The most customized view; needs enough data volume and a platform that can compute it reliably.
Calculation Steps and Example (Linear Model)
Here is a simplified linear attribution example for one customer journey.
Scenario: A prospect, Sarah, converts into a customer and generates $10,000 in Annual Recurring Revenue (ARR). Her journey includes five marketing touchpoints:
- Day 1: Clicks a Paid Search Ad (Google Ads) for "B2B attribution software."
- Day 8: Finds an organic blog post on customer journey tracking and spends time reading it.
- Day 15: Registers for and attends a webinar on multi-touch attribution.
- Day 22: Clicks a nurture email that links to a case study.
- Day 30: Requests a demo from a retargeting ad, then closes after the sales process.
Linear calculation:
With five touchpoints, each receives equal credit:
Credit per touchpoint = $10,000 / 5 = $2,000
| Touchpoint | Channel | Attributed ARR |
|---|---|---|
| Paid Search Ad | Paid Search | $2,000 |
| Organic blog post | Organic Content | $2,000 |
| Webinar | Events / Content | $2,000 |
| Nurture email | $2,000 | |
| Retargeting ad → demo | Paid Social / Retargeting | $2,000 |
Compare that to single-touch extremes:
- First-touch would give all $10,000 to Paid Search.
- Last-touch would give all $10,000 to the retargeting ad.
Neither extreme reflects the journey. Linear is imperfect, but it immediately shows why last-click reporting can starve top- and mid-funnel programs that made the deal possible.
Practical calculation steps for a full book of business:
- Collect chronological touchpoints for every closed-won deal.
- Resolve identity so anonymous visits, form fills, and CRM records map to the same person or account.
- Define the conversion event clearly (for example, closed-won ARR, not just MQL).
- Choose a model that matches how your buyers move.
- Assign fractional credit per touchpoint, then roll up by channel, campaign, and content.
- Compare at least two models side by side before making large budget changes.
Segmentation Guidance
Aggregate attribution hides the story. Segment results so decisions get sharper:
- By channel: Paid search, organic, email, events, social, partner, direct.
- By campaign: Which launches and always-on programs create attributed revenue.
- By segment: SMB vs. enterprise, industry, geography, or ICP fit.
- By deal size: Which touchpoints influence larger ARR deals.
- By sales cycle length: Short-cycle vs. long-cycle paths often need different models.
Segmentation turns attribution from a vanity rollup into budget and GTM guidance.
Interpretation and Action
What high and low credit usually means
- High credit on early-stage channels (SEO, content, brand, events) often means those programs create pipeline even when last-touch reports ignore them. Protect and fund them.
- High credit on mid-funnel channels (webinars, demos, case studies, nurture) usually means those touches move buyers from interest to intent. Improve conversion rates there before adding more top-of-funnel spend.
- High credit on late-stage channels (sales outreach, proposals, retargeting) confirms closing efficiency, but should not erase earlier influence.
- Low credit across every model is a warning sign. Either the channel is weak, tracking is broken, or the channel plays a role your model cannot see yet.
Common pitfalls
- Defaulting to last-click and cutting awareness programs that look "ineffective."
- Incomplete journey data because marketing, CRM, call tracking, and billing stay siloed.
- Weak identity resolution, so early anonymous visits never get credit.
- Measuring leads instead of revenue, which rewards volume over quality.
- Changing models every month without a baseline, which makes trends meaningless.
- Ignoring sales and product touches that influence closed-won outcomes.
How to act on the numbers
- Reallocate with evidence: Move budget toward channels that earn attributed revenue under more than one model.
- Fix tracking gaps first: If models disagree wildly, audit identity, UTM parameters, CRM sync, and conversion definitions before rewriting strategy.
- Align marketing and sales: Share journey paths for closed-won deals so both teams agree on what a quality path looks like.
- Test, then scale: Change one budget or nurture motion at a time and watch attributed revenue, CAC, and cycle length respond.
- Report in revenue terms: Stakeholders care less about clicks and more about which sources influence closed-won ARR.
How Convertmax Helps Measure Marketing Attribution
Implementing this framework is hard when your data lives in separate tools. Convertmax is a revenue intelligence platform built to connect those pieces into one measurable journey.
Convertmax helps teams:
- Unify first-party analytics across website, CRM, ads, calls, and revenue systems.
- Resolve identity so anonymous visits become known customer journeys.
- Run multi-touch attribution models (first-touch, last-touch, linear, U-shaped, time-decay, and data-driven) against closed revenue, not just form fills.
- See relationships in a Revenue Graph: sessions, people, accounts, campaigns, opportunities, and revenue events stay connected.
- Find revenue leaks and improve lead quality by showing where high-value journeys stall or succeed.
The result is attribution you can defend in a budget meeting: which channels influenced closed-won deals, and where to invest next.
Conclusion
Measuring marketing attribution in B2B SaaS means choosing a model that fits your buying journey, grounding it in first-party journey and CRM data, and acting on attributed revenue instead of last-click convenience. Start with a clear conversion definition, compare at least two models, segment by channel and deal value, then reallocate budget based on what actually influences closed-won outcomes.
If your current dashboards disagree on revenue, start with a diagnostic. Get a free Attribution Accuracy Audit or request a demo to see how Convertmax connects touchpoints to revenue.