By Elena Marsh
How to Measure Sales Performance: A Revenue Intelligence Guide
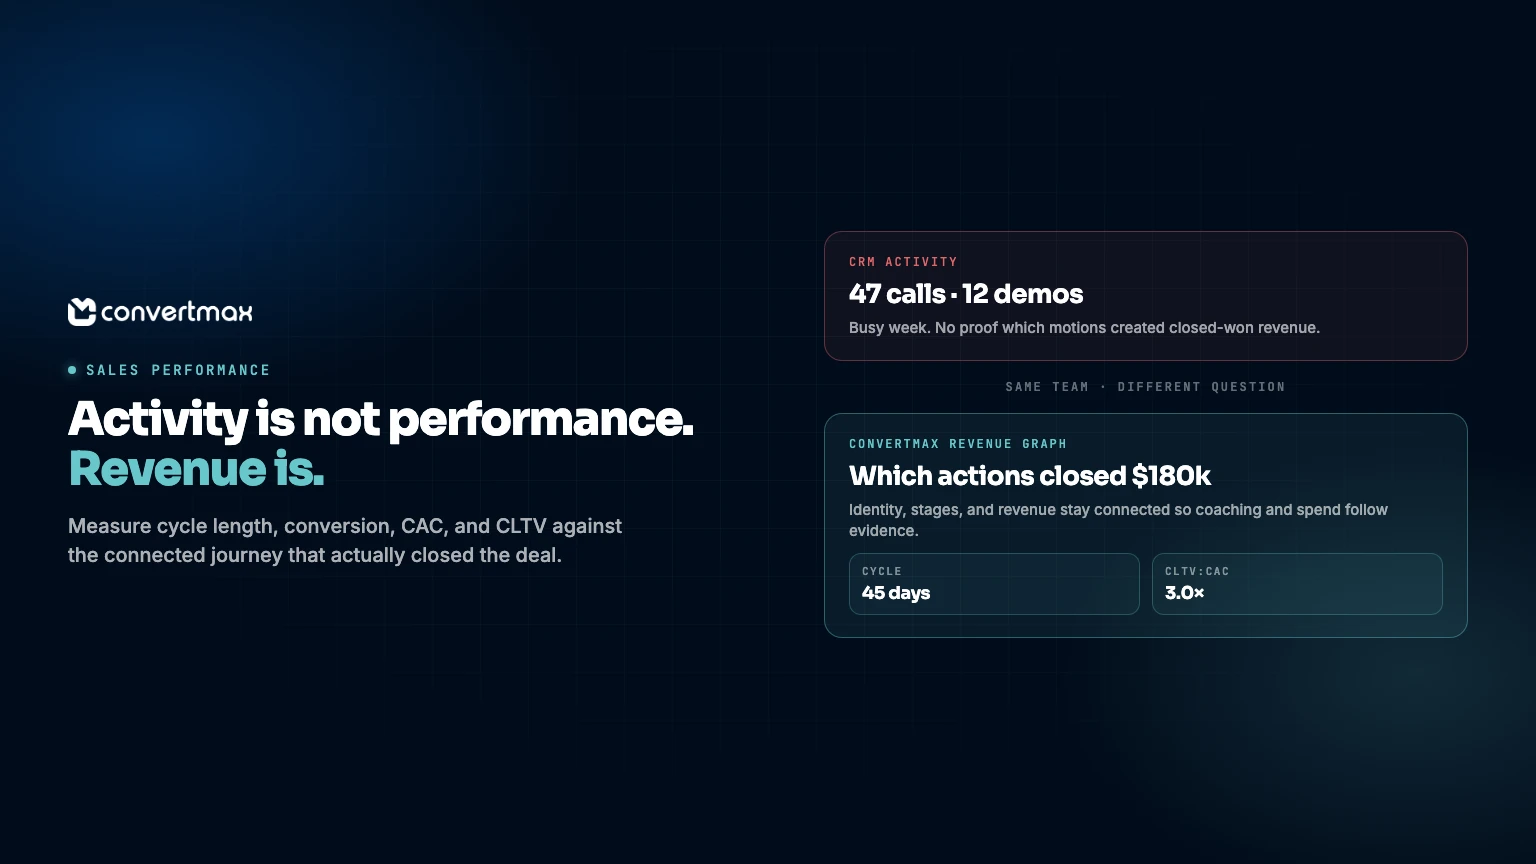
Sales performance measurement is the systematic process of evaluating how well sales activities, people, and teams produce revenue against a defined set of objectives. The useful version of that work is not a dashboard of activity counts. It is a framework that tracks the right metrics, explains what moved, and shows which actions create closed-won outcomes.
In B2B SaaS, that usually means connecting CRM activity to the customer journey: which leads convert, how long deals take, what they are worth, and what it costs to acquire and keep the customer. The goal is to turn sales from a collection of lagging reports into an evidence layer for coaching, forecasting, and investment decisions.
Why Sales Performance Measurement Matters for B2B SaaS Leaders
For founders, marketing leaders, and RevOps/GTM teams, sales performance measurement is a growth control system. When the numbers live in siloed CRMs, call tools, and billing systems, teams coach from intuition and forecast from incomplete pipeline. That leads to missed coaching opportunities, inefficient coverage, and budget fights that no one can settle with evidence.
A connected measurement practice helps teams:
- Identify revenue-driving activity: See which outreach, discovery, and closing motions show up in closed-won deals, not just busy calendars.
- Uncover process bottlenecks: Find the stage where deals stall, discount, or drop.
- Improve lead quality: Learn which sources and characteristics convert into high-value customers so marketing and sales aim at the same ICP.
- Forecast with more confidence: Ground projections in cycle length, conversion, and pipeline health instead of hope.
- Coach with specificity: Give reps feedback tied to stage conversion and deal quality, not vanity activity.
- Justify sales investment: Show the return on headcount, enablement, and tools in revenue terms.
Without that view, organizations keep optimizing activity that does not create revenue. Measurement should make sales more scientific, not more theatrical.
Sales Performance Measurement Framework
A useful framework defines each metric, states the formula, lists the data you need, walks through the calculation, and segments results so the numbers become decisions. The five metrics below cover speed, conversion, deal value, acquisition efficiency, and long-term customer worth.
1. Sales Cycle Length
Definition: The average time from first meaningful lead creation (or first sales-qualified opportunity) to closed-won.
Formula: Sales Cycle Length = Sum of (Close Date − Lead Created Date) for closed-won deals / Number of closed-won deals
Data requirements:
- Lead or opportunity created timestamps in the CRM.
- Close dates for won deals.
- A consistent starting event so one team is not measuring from MQL while another measures from first meeting.
Calculation steps:
- Identify closed-won deals in the period.
- For each deal, calculate days between the defined start event and close date.
- Sum those durations and divide by the number of won deals.
Example: Three won deals took 30, 45, and 60 days. Average sales cycle = (30 + 45 + 60) / 3 = 45 days.
Segment by: product, sales team, lead source, deal size, and customer segment. A 45-day average can hide a 21-day mid-market motion and a 90-day enterprise motion.
2. Conversion Rates by Stage
Definition: The percentage of opportunities that move from one defined funnel stage to the next, or all the way to closed-won.
Formula: Stage Conversion Rate = (Opportunities entering next stage / Opportunities in current stage) × 100
Data requirements:
- Named stages with agreed entry criteria (Lead, Qualified, Proposal, Negotiation, Closed-Won).
- Accurate stage history, not just the current stage on the record.
- A time window so you are measuring a cohort, not a snapshot of whatever happens to sit in the funnel today.
Calculation steps:
- Define stage entry and exit rules.
- Count opportunities that entered a stage in the period.
- Count how many of those moved to the next stage.
- Apply the formula for each transition.
Example: 100 qualified opportunities enter Proposal and 40 move to Negotiation. Conversion rate = (40 / 100) × 100 = 40%.
Segment by: rep, team, lead source, product, and industry. Low conversion in one stage is a coaching problem; low conversion in one source is a lead-quality problem.
3. Average Deal Size
Definition: Average revenue generated per closed-won deal.
Formula: Average Deal Size = Total Revenue from Closed-Won Deals / Number of Closed-Won Deals
Data requirements:
- Won-deal revenue from CRM, billing, or both, using the same definition (ACV, ARR, or first invoice).
- A clear inclusion rule for expansions, multi-year contracts, and one-time professional services.
Calculation steps:
- Sum closed-won revenue in the period.
- Divide by the number of won deals.
Example: 10 closed deals produce $100,000. Average deal size = $100,000 / 10 = $10,000.
Segment by: rep, product, customer segment, and lead source. Average deal size tells you whether the team is winning the right work, not just more work.
4. Customer Acquisition Cost (CAC)
Definition: Total sales and marketing cost required to acquire one new customer in a period.
Formula: CAC = (Total Sales and Marketing Expenses) / Number of New Customers Acquired
Data requirements:
- Fully loaded sales and marketing spend for the same period (salaries, tools, ads, agencies, commissions as your finance team defines them).
- New customers acquired in that period, not MQLs or opportunities.
Calculation steps:
- Sum sales and marketing expenses for the period.
- Count new customers acquired in the same period.
- Divide spend by new customers.
Example: Quarterly sales and marketing spend is $50,000 and 50 new customers join. CAC = $50,000 / 50 = $1,000.
Segment by: channel and lead source. Blended CAC can look healthy while one paid motion is unprofitable. For the broader marketing view, see how to measure marketing attribution.
5. Customer Lifetime Value (CLTV)
Definition: Predicted total revenue a customer will generate over the relationship.
Formula: CLTV = (Average Purchase Value × Average Purchase Frequency) × Average Customer Lifespan
A SaaS-friendly variant is: CLTV = Average Revenue Per Account × Gross Margin × Average Customer Lifespan in years.
Data requirements:
- Purchase or subscription history from billing.
- Churn or lifespan from customer success or finance.
- A join between CRM accounts and revenue events so acquisition source and expansion stay attached to the same customer.
Calculation steps:
- Calculate average purchase value: total revenue / total purchases (or ARPA for subscription businesses).
- Calculate purchase frequency, or use 1 for annual contracts.
- Estimate lifespan as 1 / customer churn rate when churn is known.
- Multiply the components.
Example: Average purchase value $200, frequency 3 per year, lifespan 5 years. CLTV = $200 × 3 × 5 = $3,000.
Segment by: acquisition channel, product, and customer segment. High CLTV from one source should change both sales targeting and marketing spend.
A practical health check is the CLTV:CAC ratio. Many B2B SaaS teams look for roughly 3:1 or better, then inspect payback period before scaling a motion.
Interpretation and Action
A metric is rarely good or bad in isolation. Read each number against trend, segment, and the adjacent metrics before you change quota, coverage, or spend.
Sales Cycle Length
- Long: Process friction, a poorly qualified pipeline, or a genuinely complex offering. Action: tighten stage criteria, add enablement at the stall point, or refine ICP.
- Short: Efficient process or strong product-market fit. Action: document the path and replicate it; confirm you are not winning only small, easy deals.
- Pitfall: Mixing start events (form fill vs. SQL vs. first meeting) so teams argue about a number that is not comparable.
Conversion Rates by Stage
- Low early: Weak lead quality or poor first conversations. Action: improve scoring, tighten marketing targeting, or coach SDRs on discovery.
- Low in the middle: Value, pricing, or differentiation is not landing. Action: revisit messaging, proposal quality, and competitive positioning in the deal review.
- Low late: Closing, objection handling, or commercial terms are the issue. Action: deal inspection, closer training, and clearer discount governance.
- Pitfall: Measuring a funnel snapshot instead of a cohort. Opportunities sitting in Negotiation today are not the same set that entered Proposal last quarter.
Average Deal Size
- High: Strong expansion, value selling, or enterprise targeting. Action: protect the motion and train more reps on it.
- Low: Smaller logos, discounting, or a mix shift toward low-ACV products. Action: inspect discounting, packaging, and whether marketing is feeding the wrong segment.
Customer Acquisition Cost
- High: Inefficient spend, long cycles, or low win rates. Action: fix conversion and cycle length before pouring more budget into the top of the funnel.
- Low: Efficient acquisition. Action: scale the channels that still produce quality pipeline, and watch CAC as volume grows.
- Pitfall: Counting MQLs in the denominator. CAC is a customer metric.
Customer Lifetime Value
- High: Product-market fit and retention are working. Action: invest in expansion and the acquisition sources that produce those customers.
- Low: Churn, weak expansion, or a mismatch between promised and delivered value. Action: fix onboarding and customer success before scaling acquisition.
- Pitfall: Reporting CLTV without CAC, or CAC without lifespan. The pair is the decision.
Common pitfalls to avoid
- Vanity activity metrics (calls, emails, meetings) with no link to pipeline or revenue.
- Data silos between CRM, marketing automation, product, and billing.
- Metrics without context, such as a longer cycle that is actually a shift into enterprise.
- Inconsistent definitions across sales, marketing, and finance.
- Only lagging indicators, with no leading view of stage conversion or pipeline coverage.
- Ignoring qualitative input from reps and customers when the numbers change.
How Convertmax Connects Sales Performance to Revenue
Traditional sales reporting often stops at CRM fields: stage, owner, amount, close date. That is necessary operational data. It is not enough to explain why deals are won, which early anonymous touches created the opportunity, or where revenue leaked before a rep ever owned the record. Convertmax is a revenue intelligence platform built to close that gap with a connected Revenue Graph.
Convertmax helps teams:
- Unify first-party analytics across website, CRM, sales engagement, ads, calls, and billing so sales activity and marketing interaction sit on the same timeline.
- Resolve identity so anonymous visits, known contacts, accounts, and closed-won deals stay linked. Early research is not erased when a form is filled.
- Preserve relationships among sessions, people, accounts, campaigns, calls, opportunities, orders, and revenue events, so you can inspect the path rather than a single source field.
- Run multi-touch attribution against closed revenue. Compare first-touch, last-touch, linear, U-shaped, time-decay, and data-driven models on the same journey.
- Find revenue leaks where opportunities stall, and improve lead quality by connecting won-deal outcomes back to source and journey patterns.
- Give founders, sales leaders, and RevOps one evidence layer for coaching, coverage, and investment decisions.
That is the difference between reporting that sales made 47 calls and knowing which sequences of marketing and sales touches produced closed-won revenue. For the journey-level view that sits underneath these metrics, see how to measure customer journeys.
Conclusion
Measuring sales performance in B2B SaaS means defining cycle length, stage conversion, deal size, CAC, and CLTV with discipline, segmenting the results, and acting on connected evidence instead of isolated CRM snapshots. The next step is joining those sales metrics to the full customer journey so marketing, sales, and finance optimize the same revenue engine.
If sales activity and closed revenue still live in separate dashboards, start with a diagnostic. Get a free Attribution Accuracy Audit or request a demo to see how Convertmax connects sales performance to revenue.